
Find + aggregate explain
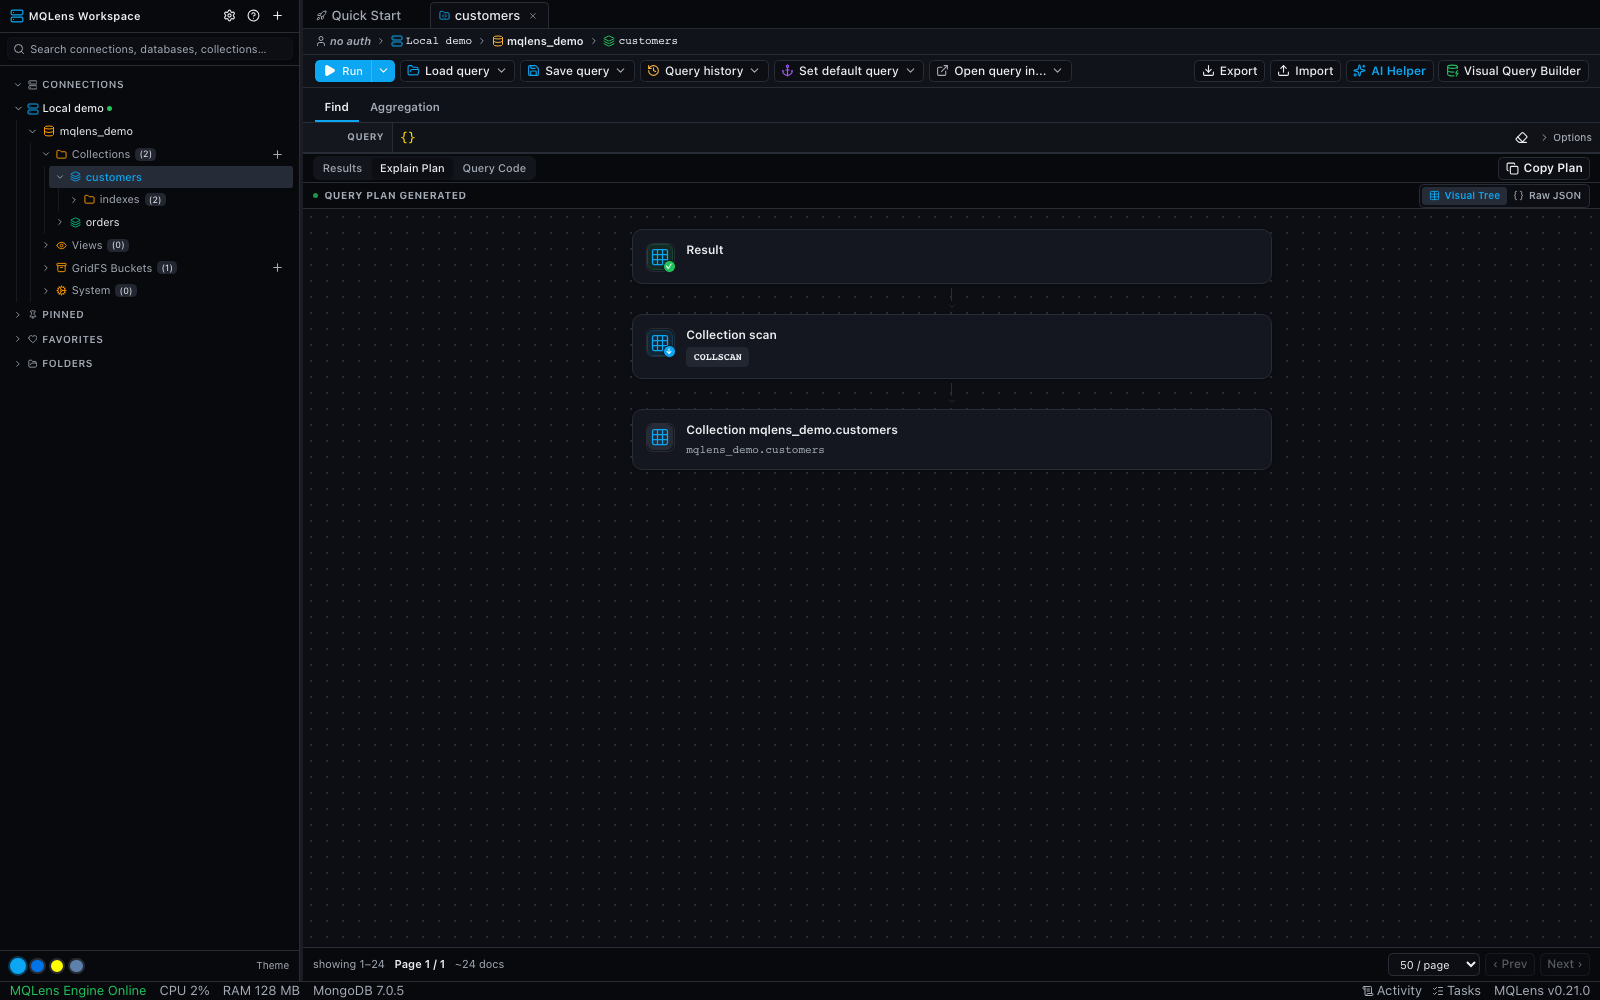
Visual plan tree for both query types, not just a JSON dump.
Raw explain() output is a deeply nested JSON blob. MQLens renders the winning plan as a readable tree for both find and aggregate — so index usage, COLLSCANs, in-memory sorts, and query stages are easier to follow.
Free & open source (Apache-2.0) · No telemetry · No account.
Enter a find filter or build an aggregation pipeline.
Choose Run Explain from the Run dropdown, or open the Explain Plan tab.
Follow scans and sorts in the visual tree, then switch to Raw JSON to compare documents examined and returned.
Create indexes from the GUI with real key patterns and unique / sparse flags, then re-explain to confirm the win.
Visual plan tree for both query types, not just a JSON dump.
Create, inspect, and drop indexes with real key patterns and unique/sparse flags.
A real shell wired to your connection for the moments a GUI can’t reach.
6,303 release asset downloads
Windows 10 or later (x64)
Download the installer, run it, and launch MQLens from the Start menu.
macOS 11 (Big Sur) or later
Download the .dmg, open it, and drag MQLens to your Applications folder.
Ubuntu 20.04+, Fedora 36+, or equivalent (x64)
Debian/Ubuntu: install the .deb. Fedora/RHEL: install the .rpm. An AppImage is also available.
Free, open source, native — yours to inspect and run.
Download for free